Print methods for test_ph()
Usage
# S3 method for class 'test_ph'
print(x, ...)Examples
ph_results <- test_ph(
data = easysurv::easy_bc,
time = "recyrs",
event = "censrec",
group = "group"
)
ph_results
#>
#> ── Testing Survival Curve Differences ──────────────────────────────────────────
#> ℹ `survival::survdiff()` found a p-value of 0.
#> ✔ suggests survival differences between groups are statistically significant.
#>
#> ── Testing Proportional Hazards Assumption ─────────────────────────────────────
#>
#> ── Cox Proportional Hazards Model ──
#>
#> `survival::coxph()` output:
#>
#> coef exp(coef) se(coef) z Pr(>|z|)
#> groupMedium 0.8401002 2.316599 0.1713926 4.901613 9.505295e-07
#> groupPoor 1.6180720 5.043358 0.1645443 9.833656 8.063728e-23
#>
#> The exp(coef) column shows the hazard ratios were 2.317 and 5.043.
#>
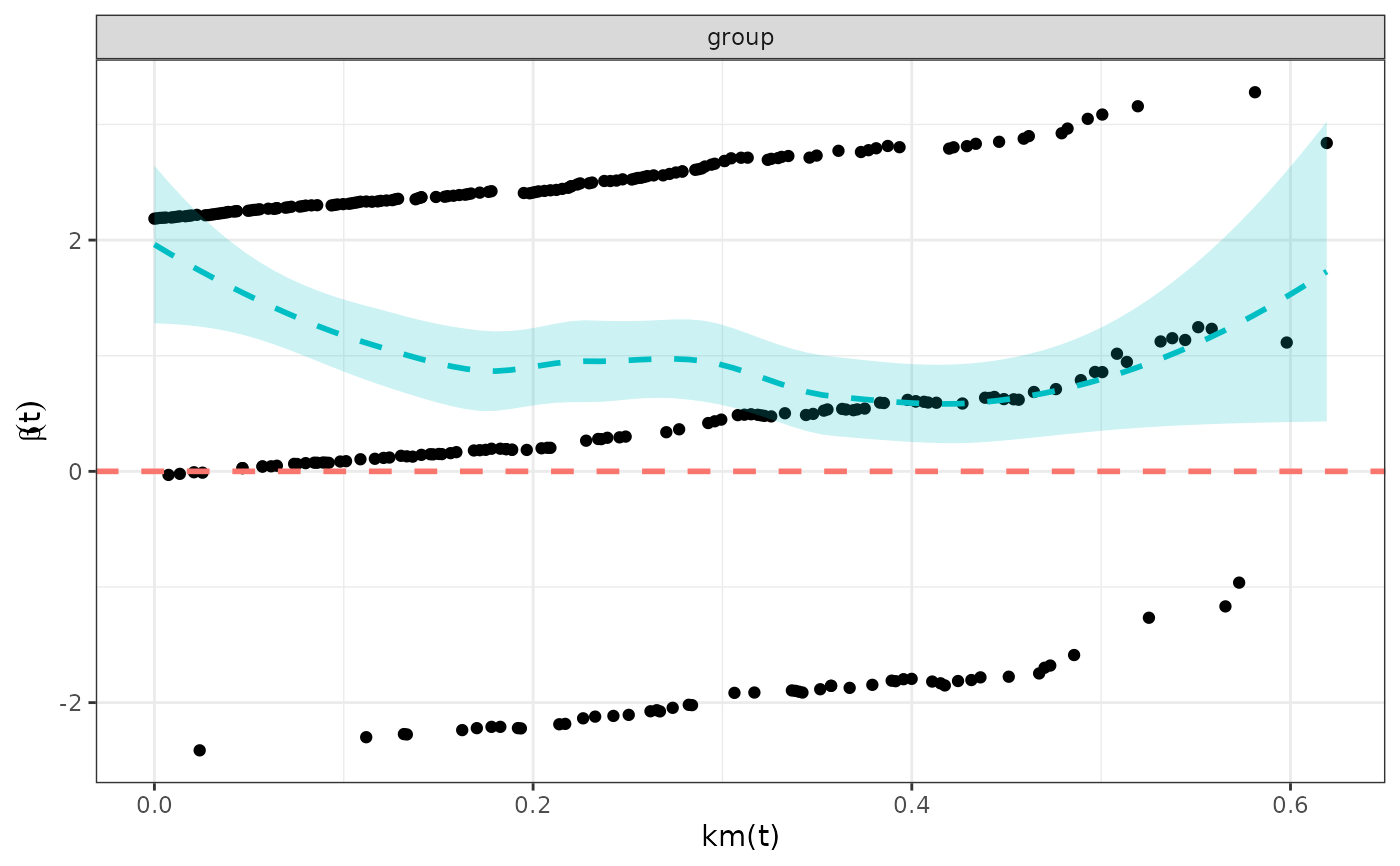
#> ℹ `survival::cox.zph()` found a p-value of 0.017.
#> ! suggests the PH assumption may not be valid.
#>
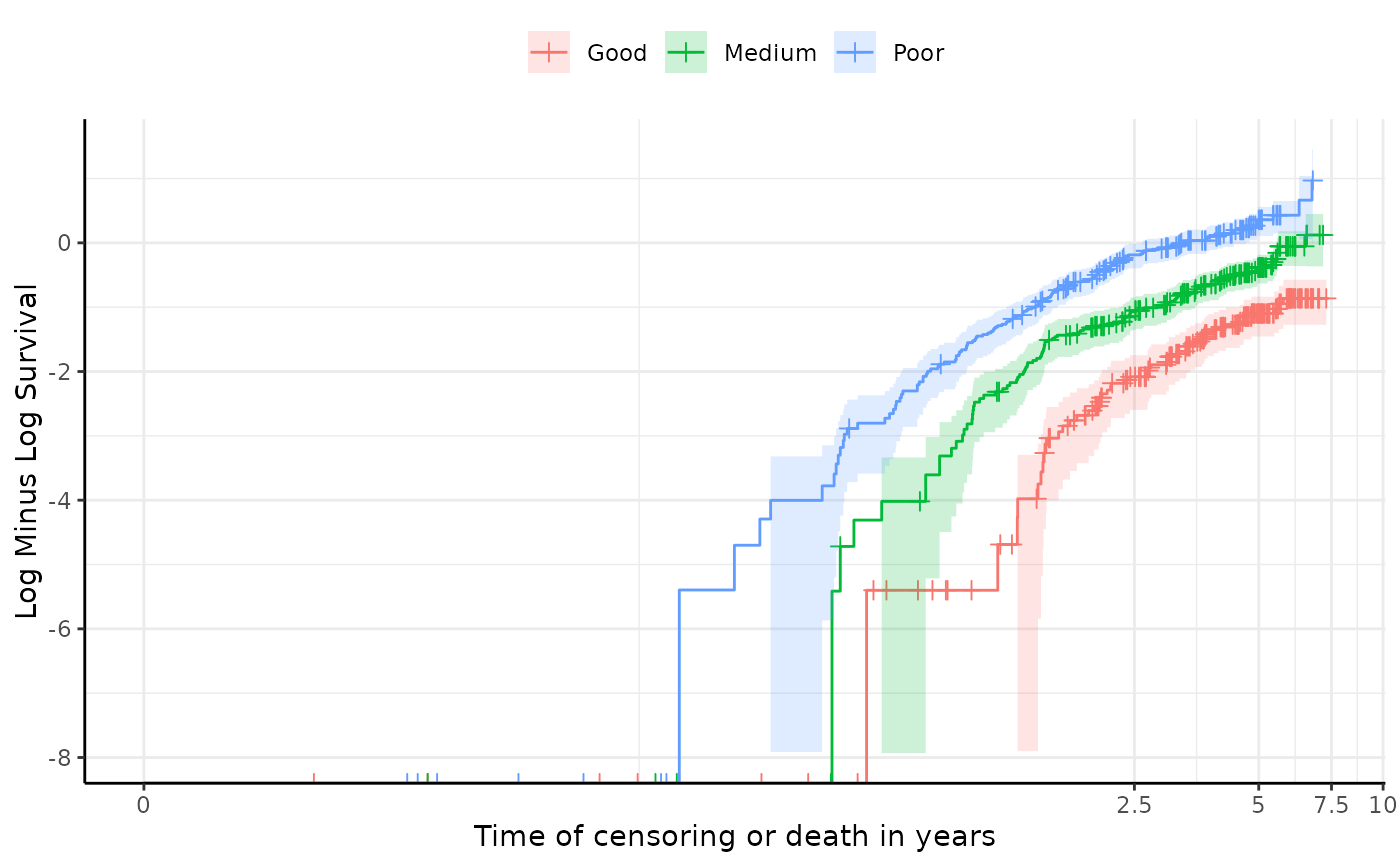
#> ── Plots ──
#>
#> ℹ Schoenfeld residuals and log cumulative hazard plots have been printed.
#> ℹ PH tests may not always agree, so consider the results of all tests and plots in totality.
#> ────────────────────────────────────────────────────────────────────────────────
#> → For more information, run `View()` on saved `test_ph()` output.