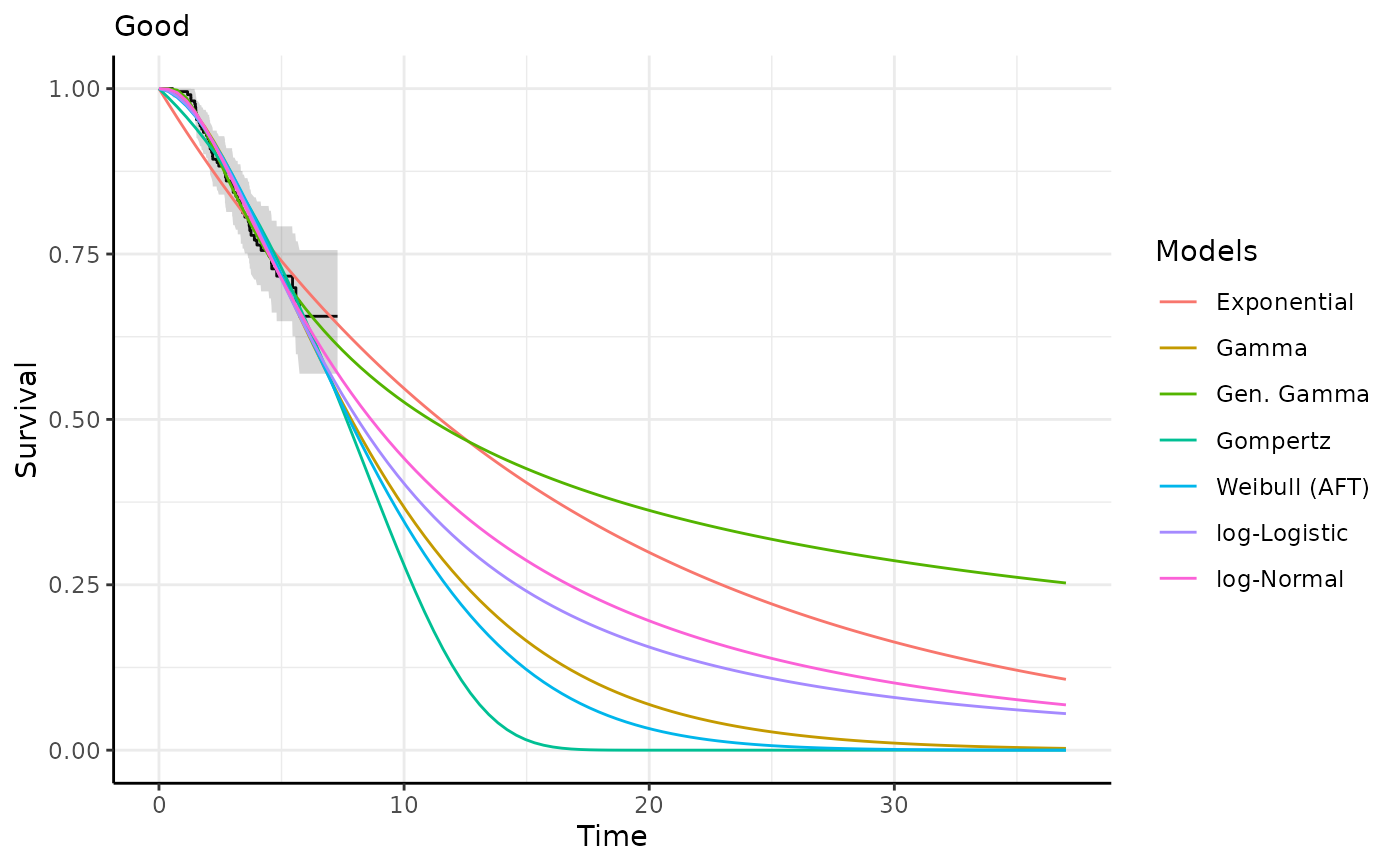
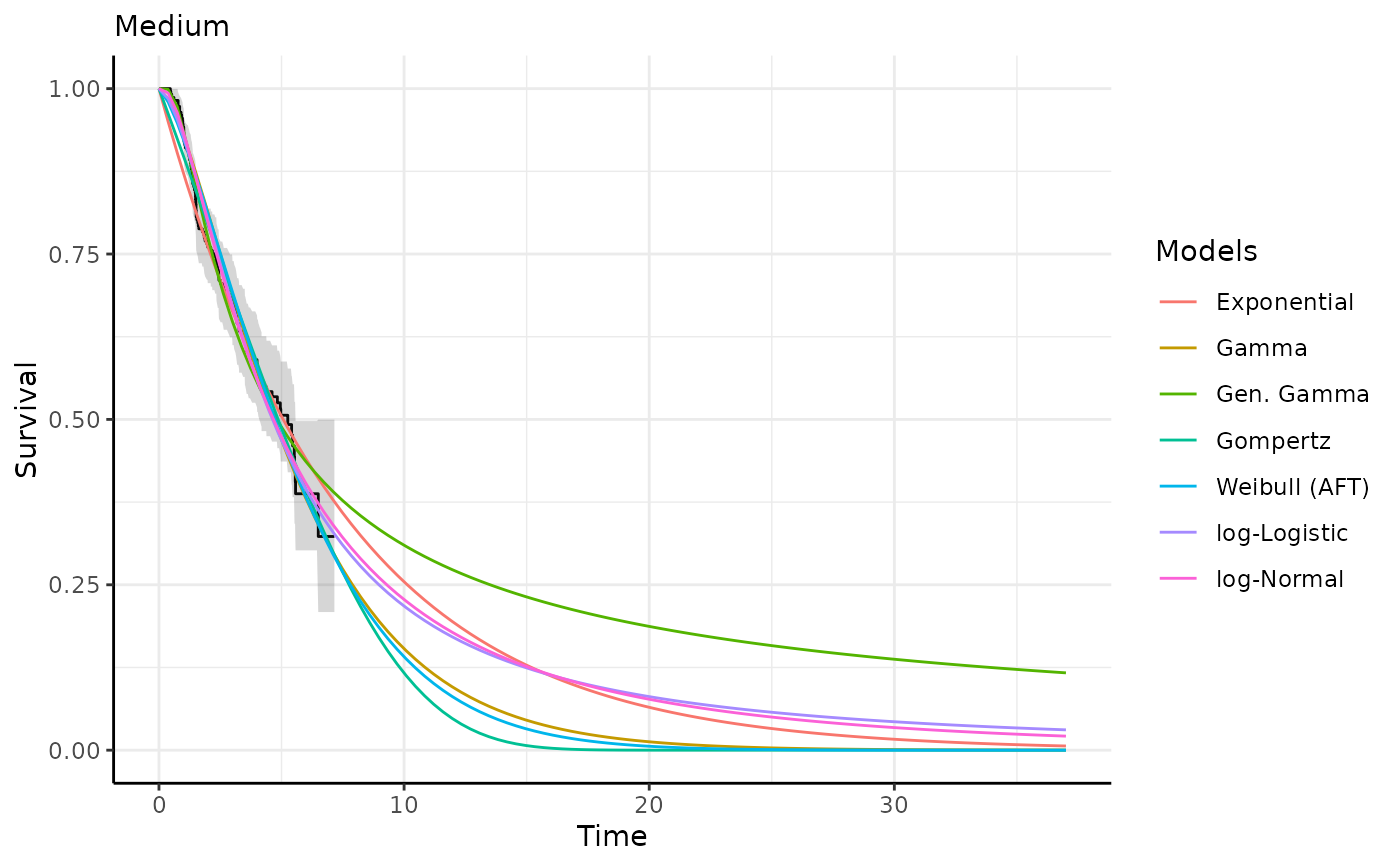
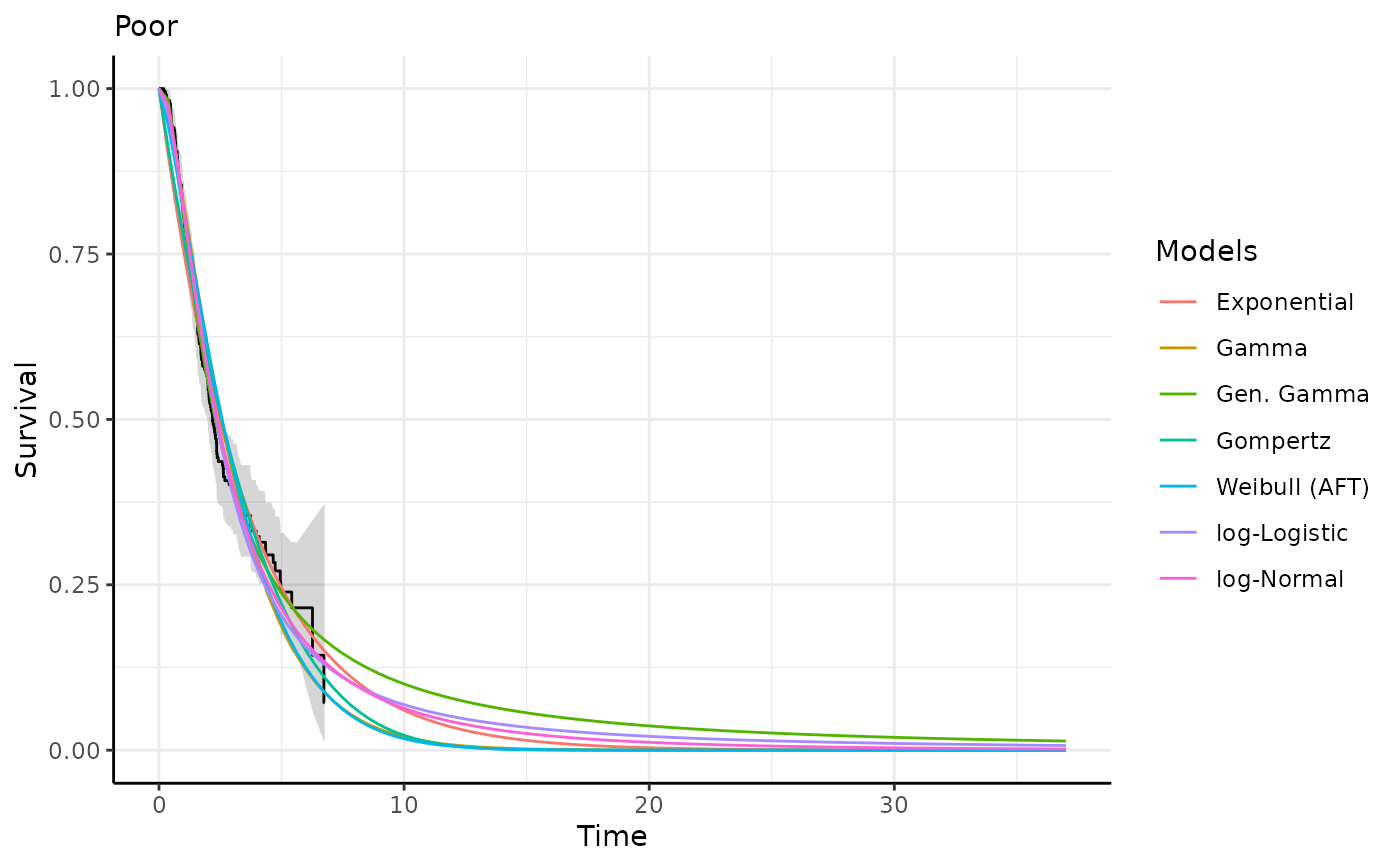
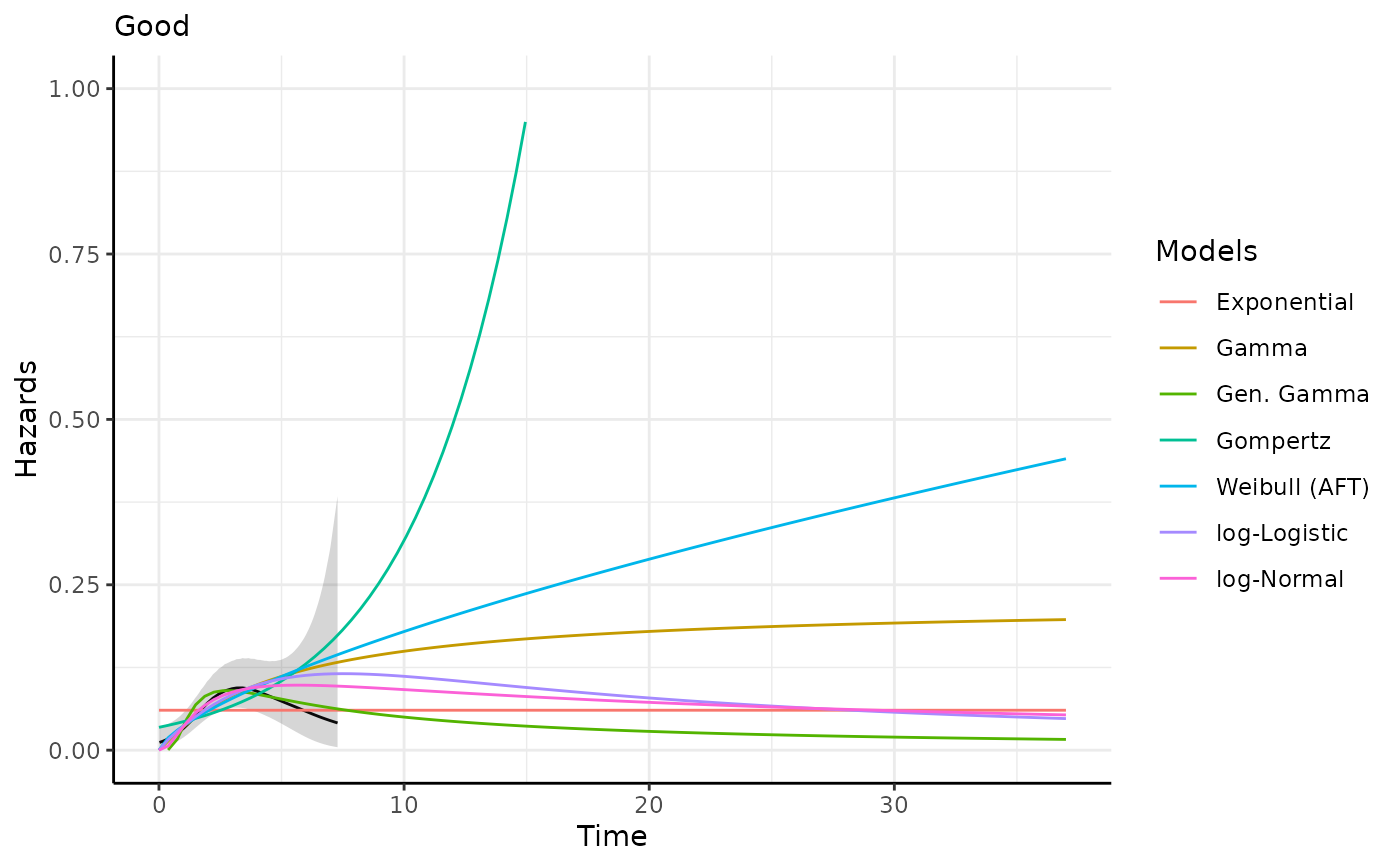
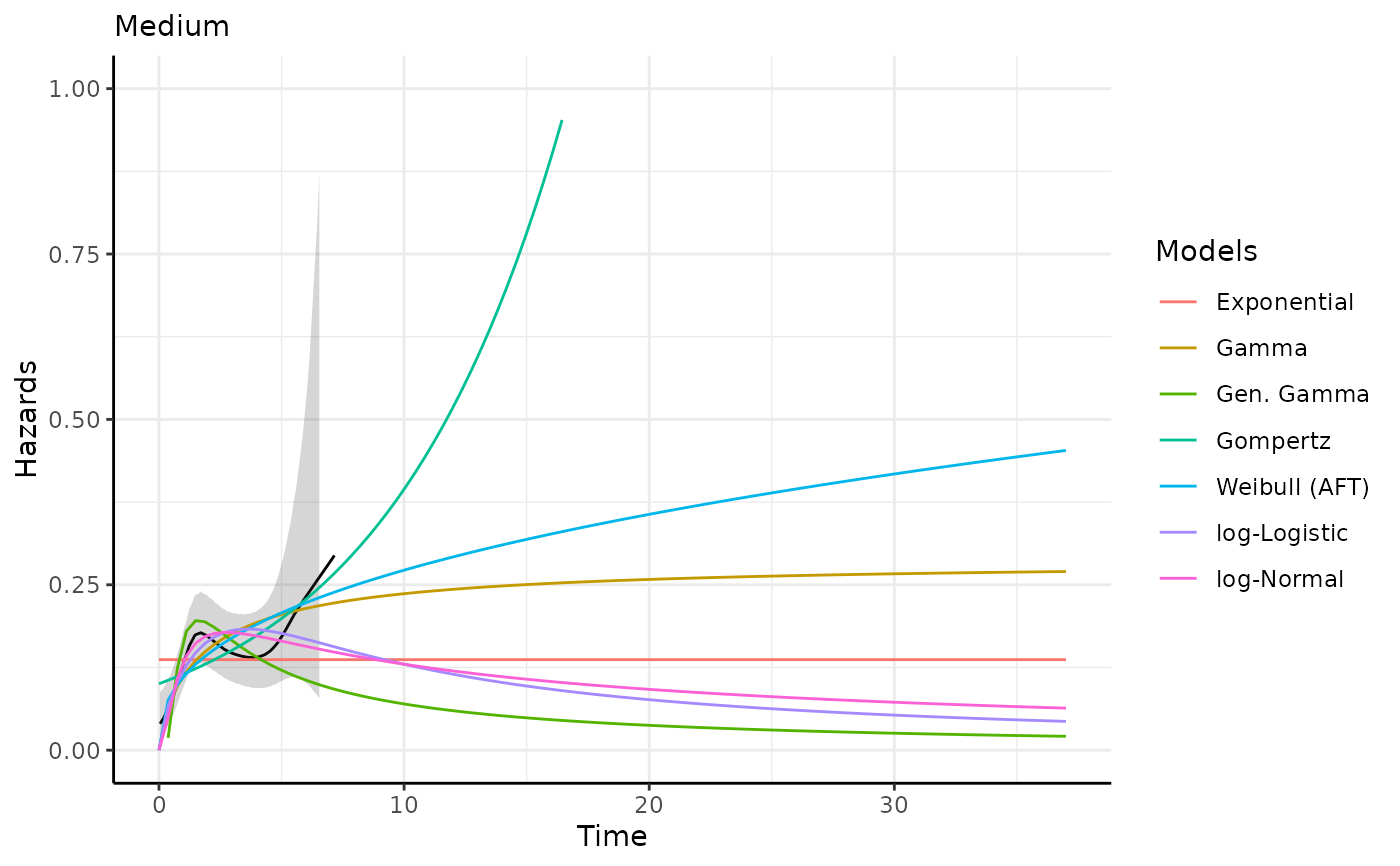
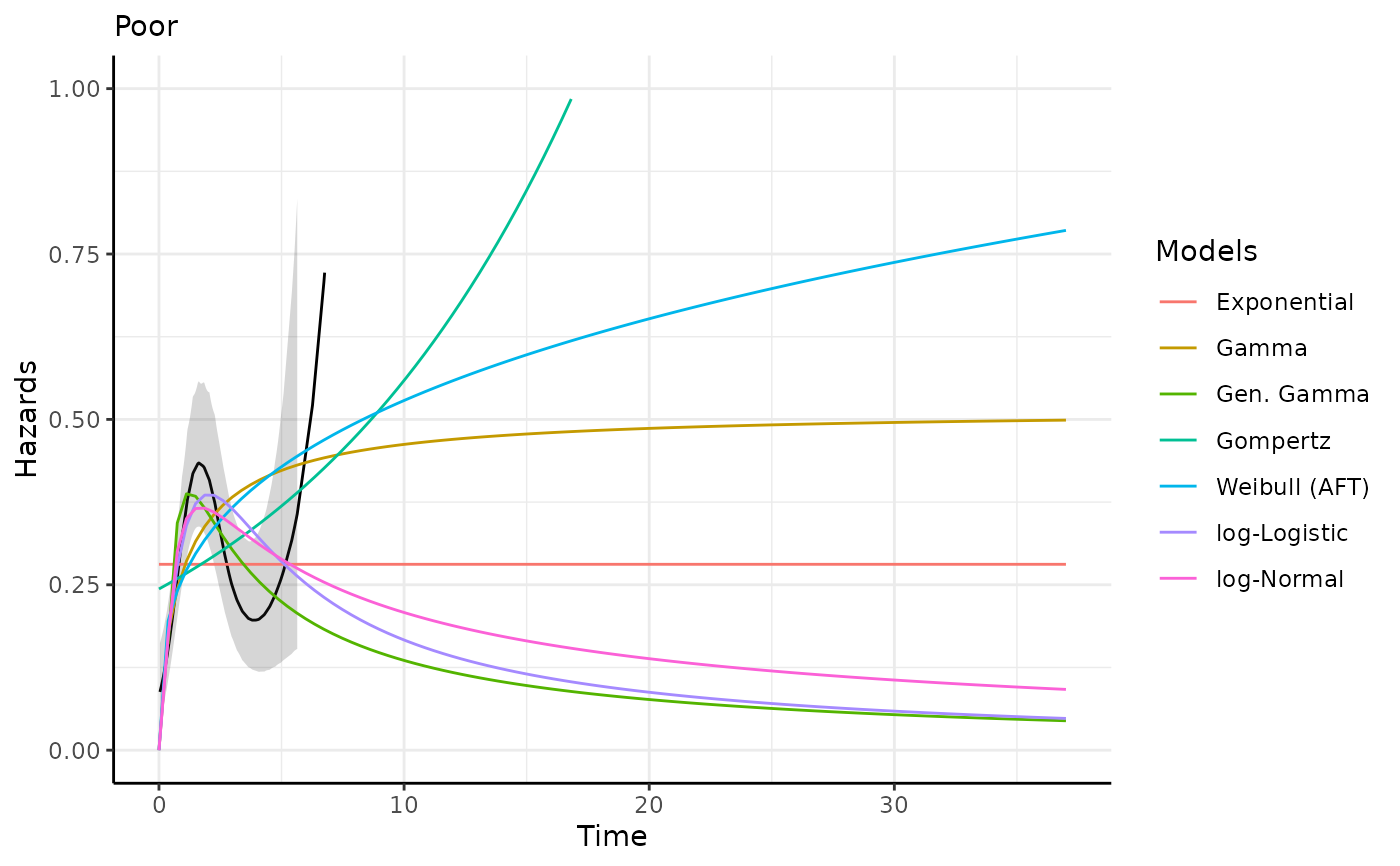
This function generates survival and hazard predictions and plots for each
model in a fit_models object. Optionally, interactive plotly
outputs can be added for each plot.
Usage
predict_and_plot(
  fit_models,
  eval_time = NULL,
  km_include = TRUE,
  subtitle_include = TRUE,
  add_plotly = FALSE
)
Arguments
- fit_models
An object returned from fit_models.
- eval_time
(Optional) A vector of evaluation time points for generating predictions. Default is
NULL, which if left as NULL, generates a sequence from 0 to 5 times the maximum observed time.- km_include
A logical indicating whether to include Kaplan-Meier estimates in the plot outputs. Default is
TRUE.- subtitle_include
A logical indicating whether to include the subtitle. Default is
TRUE. The subtitle is the name of the group.- add_plotly
A logical indicating whether to add interactive plotly outputs for each plot. Default is
FALSE.
Examples
models <- fit_models(
  data = easysurv::easy_bc,
  time = "recyrs",
  event = "censrec",
  predict_by = "group"
)

predict_and_plot(models)
#> ℹ Survival plots have been printed.
#> ℹ Hazard plots have been printed.