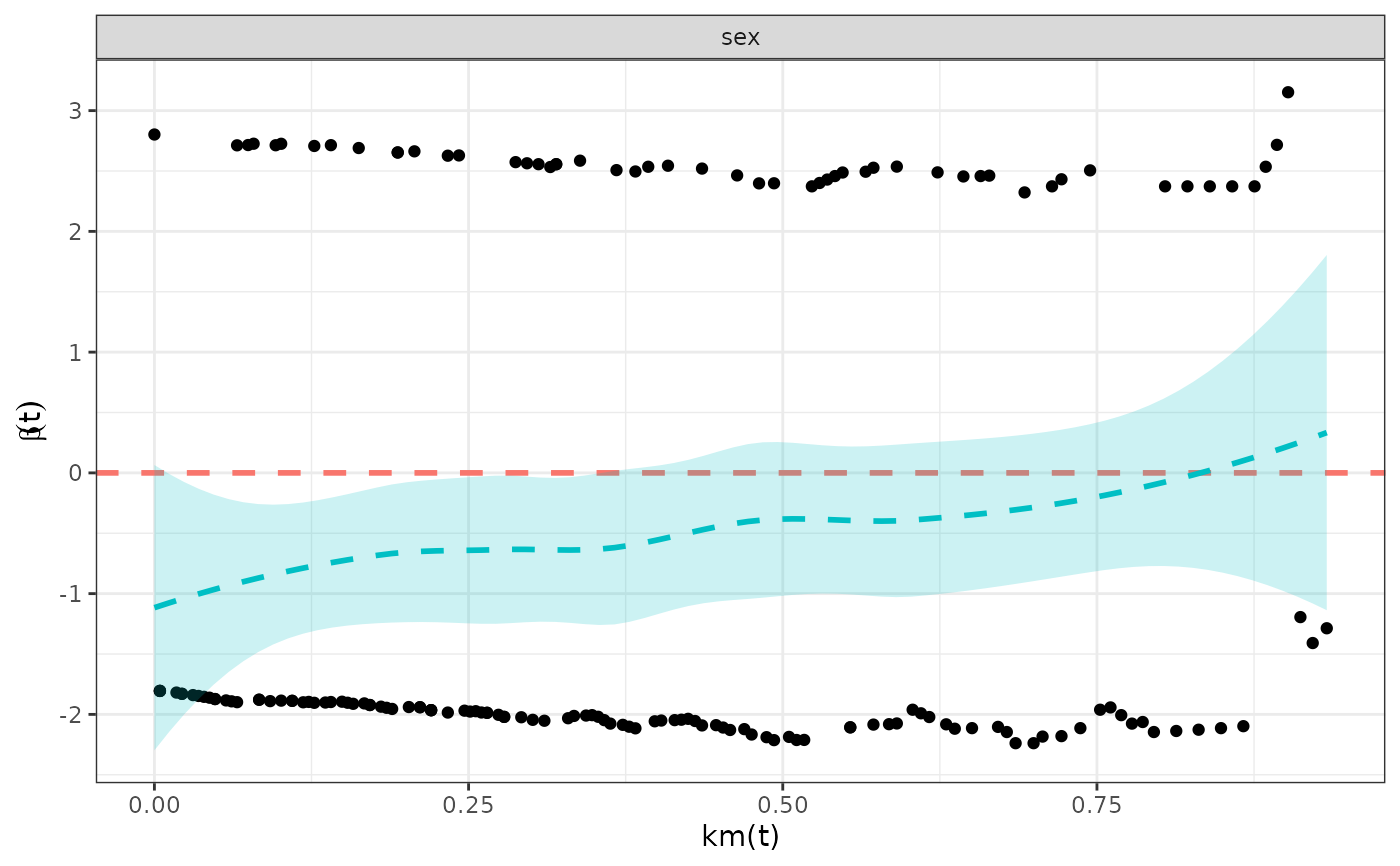
Plot the residuals generated by the get_schoenfeld function.
This function creates a visual representation of Schoenfeld residuals from a
Cox proportional hazards model.
It allows for customization of the plot, including the addition of horizontal
and smoothed lines, and styling of points and plot elements.
Usage
plot_schoenfeld(
  residuals,
  hline = TRUE,
  sline = TRUE,
  sline_se = TRUE,
  hline_col = "#F8766D",
  hline_size = 1,
  hline_alpha = 1,
  hline_yintercept = 0,
  hline_lty = "dashed",
  sline_col = "#00BFC4",
  sline_size = 1,
  sline_alpha = 0.2,
  sline_lty = "dashed",
  point_col = "black",
  point_size = 1,
  point_shape = 19,
  point_alpha = 1,
  plot_theme = ggplot2::theme_bw()
)
Arguments
- residuals
A data frame containing the Schoenfeld residuals, typically with columns
time,residual,transform, andvariable.- hline
Logical. If
TRUE, a horizontal line is added to the plot. Default isTRUE.- sline
Logical. If
TRUE, a smooth line is added to the plot. Default isTRUE.- sline_se
Logical. If
TRUE, confidence intervals are displayed around the smooth line. Default isTRUE.- hline_col
Color of the horizontal line. Default is
"#F8766D"(red).- hline_size
Line width of the horizontal line. Default is
1.- hline_alpha
Transparency of the horizontal line. Default is
1.- hline_yintercept
Y-intercept for the horizontal line. Default is
0.- hline_lty
Line type for the horizontal line. Default is
"dashed".- sline_col
Color of the smooth line. Default is
"#00BFC4"(blue).- sline_size
Line width of the smooth line. Default is
1.- sline_alpha
Transparency of the smooth line. Default is
0.2.- sline_lty
Line type for the smooth line. Default is
"dashed".- point_col
Color of the points representing residuals. Default is
"black".- point_size
Size of the points representing residuals. Default is
1.- point_shape
Shape of the points representing residuals. Default is
19.- point_alpha
Transparency of the points representing residuals. Default is
1.- plot_theme
A ggplot2 theme for the plot. Default is
ggplot2::theme_bw().