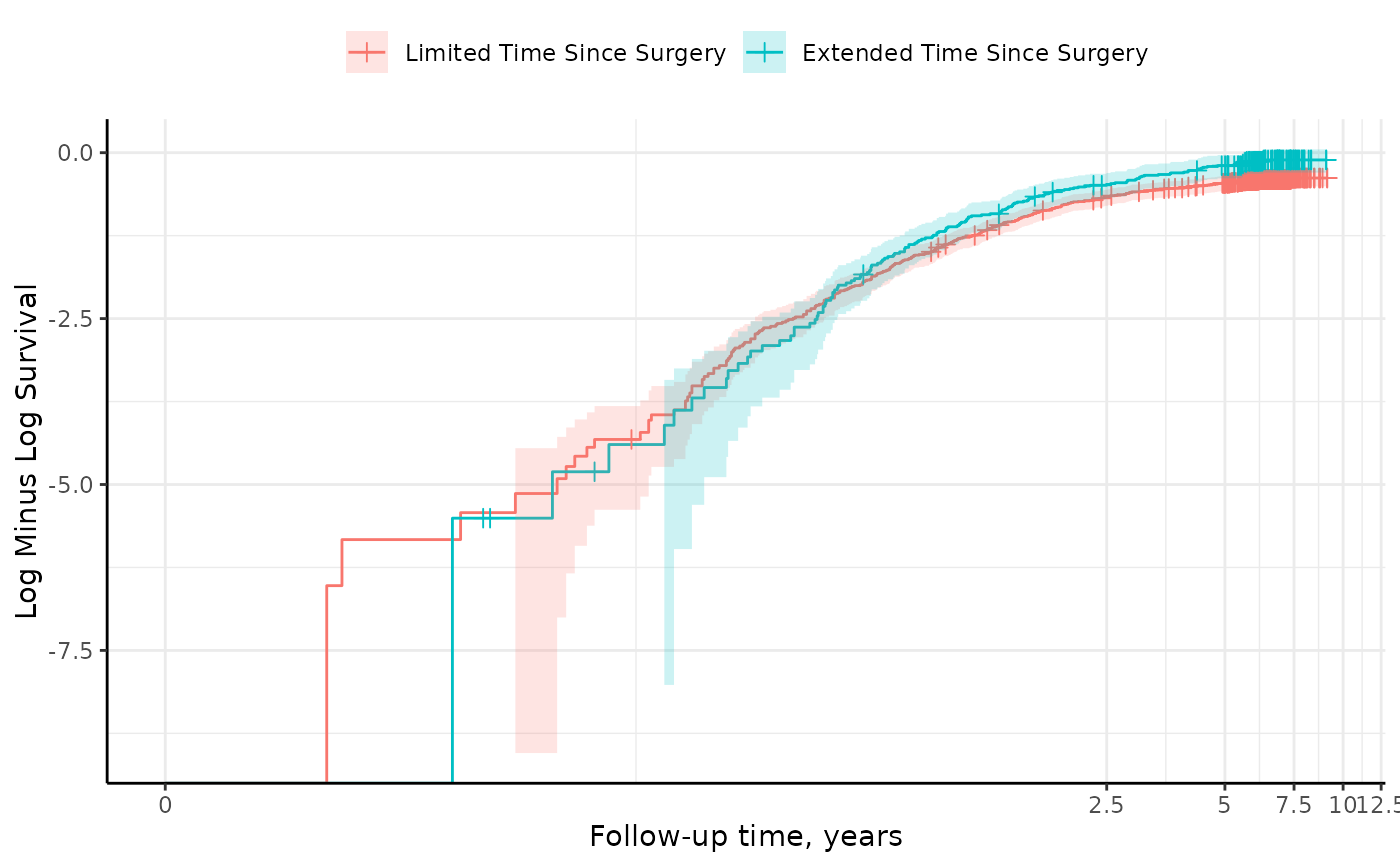
Generates a Cumulative Log Log survival curve plot using
ggsurvfit::ggsurvfit() with customizable options.
Usage
plot_cloglog(
  fit,
  median_line = FALSE,
  legend_position = "top",
  plot_theme = theme_easysurv()
)
Arguments
- fit
A survival::survfit object representing the survival data.
- median_line
Logical value indicating whether to include a line representing the median survival time. Default is
FALSE.- legend_position
Position of the legend in the plot. Default is "top".
- plot_theme
ggplot2 theme for the plot. Default is
theme_easysurv().