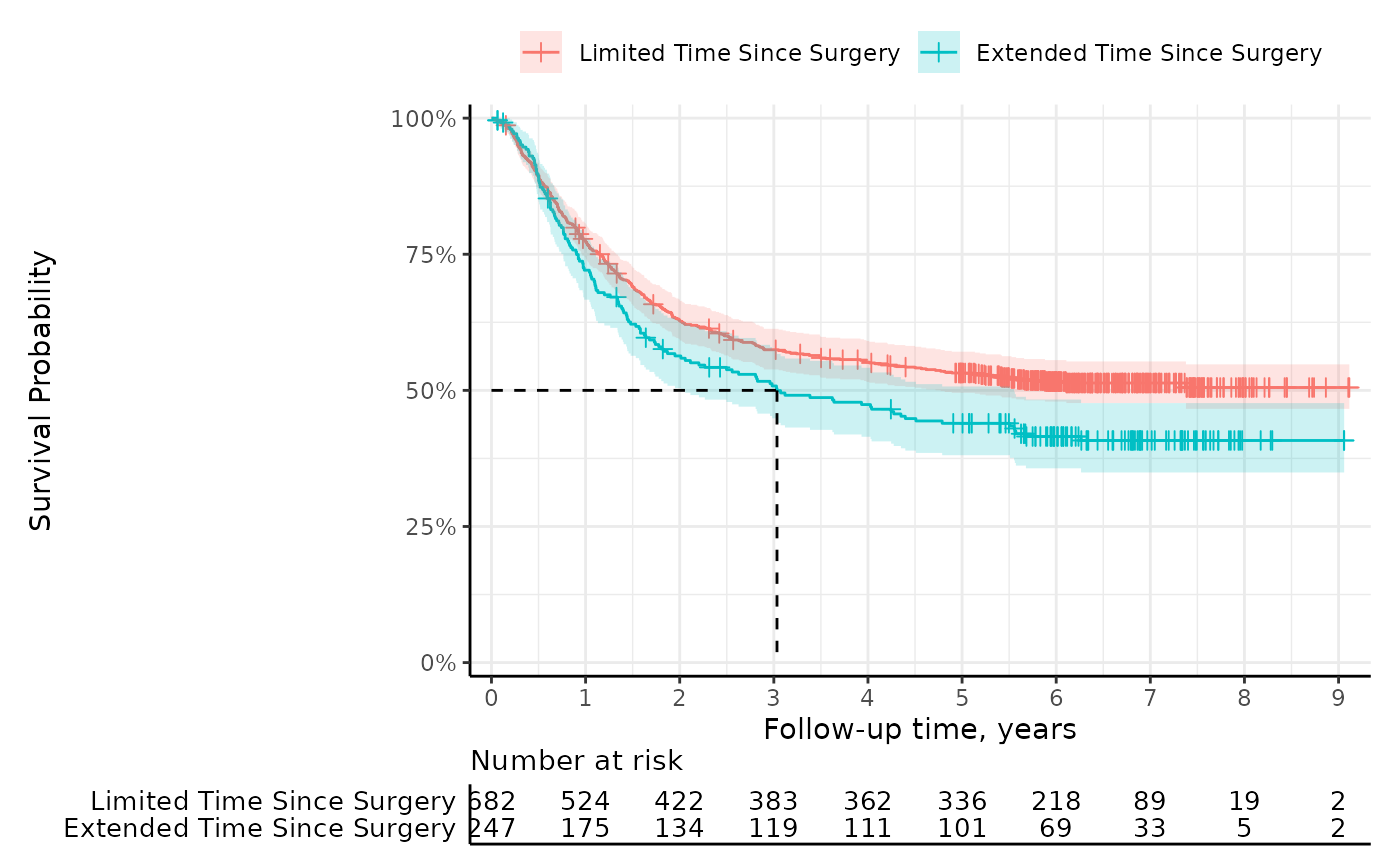
Generates a Kaplan-Meier survival curve plot using
ggsurvfit::ggsurvfit() with customizable options.
This function provides sensible defaults while allowing for customization.
Usage
plot_km(
  fit,
  risktable = TRUE,
  risktable_symbols = TRUE,
  median_line = TRUE,
  legend_position = "top",
  plot_theme = theme_easysurv(),
  risktable_theme = theme_risktable_easysurv()
)
Arguments
- fit
A survival::survfit object representing the survival data.
- risktable
Logical value indicating whether to include a risk table below the plot. Default is
TRUE.- risktable_symbols
Logical value indicating whether to include symbols instead of text to label risk table strata. Default is
TRUE.- median_line
Logical value indicating whether to include a line representing the median survival time. Default is
TRUE.- legend_position
Position of the legend in the plot. Default is "top".
- plot_theme
ggplot2 theme for the plot. Default is
theme_easysurv().- risktable_theme
ggplot2 theme for the risk table. Default is
theme_risktable_easysurv().