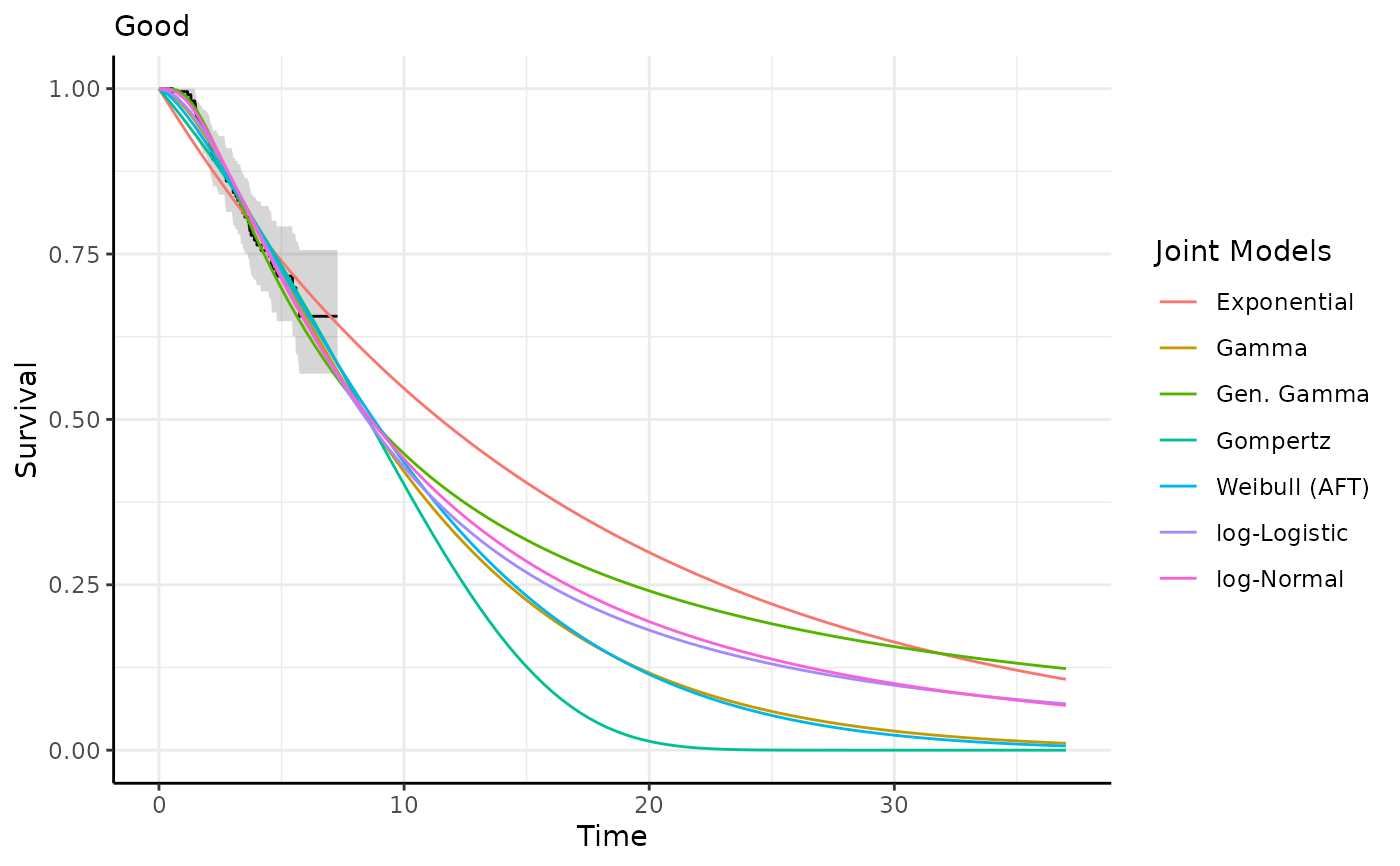
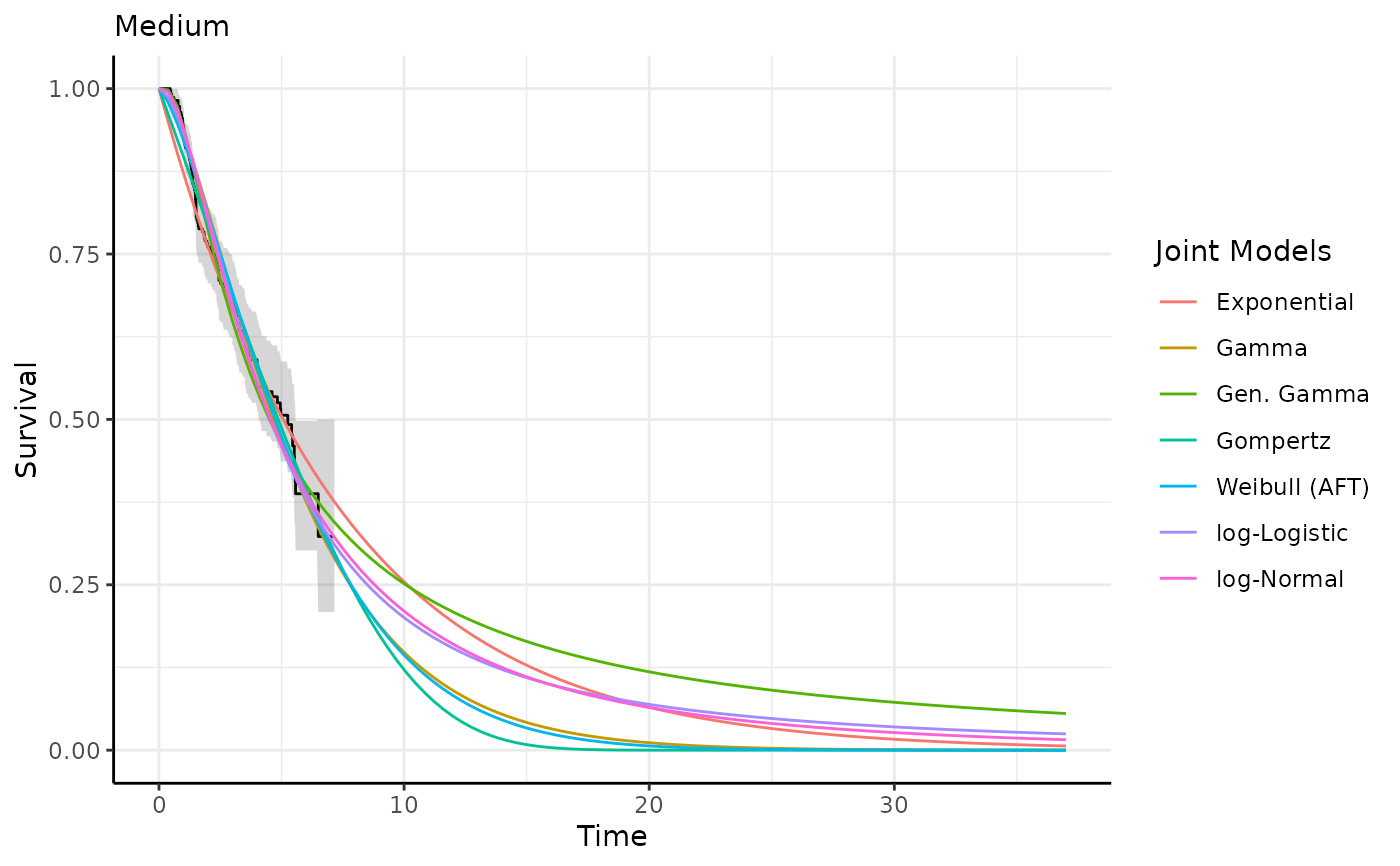
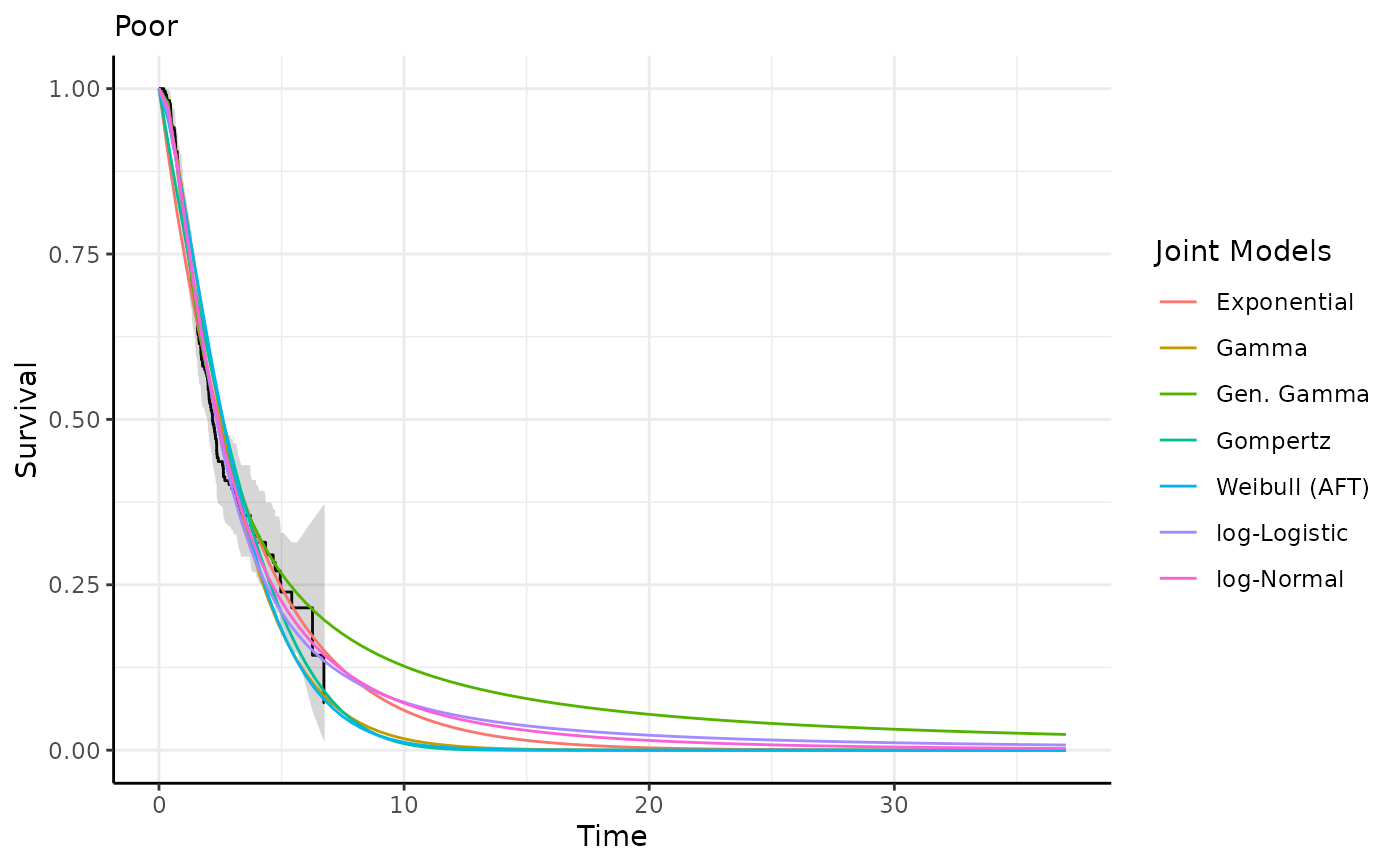
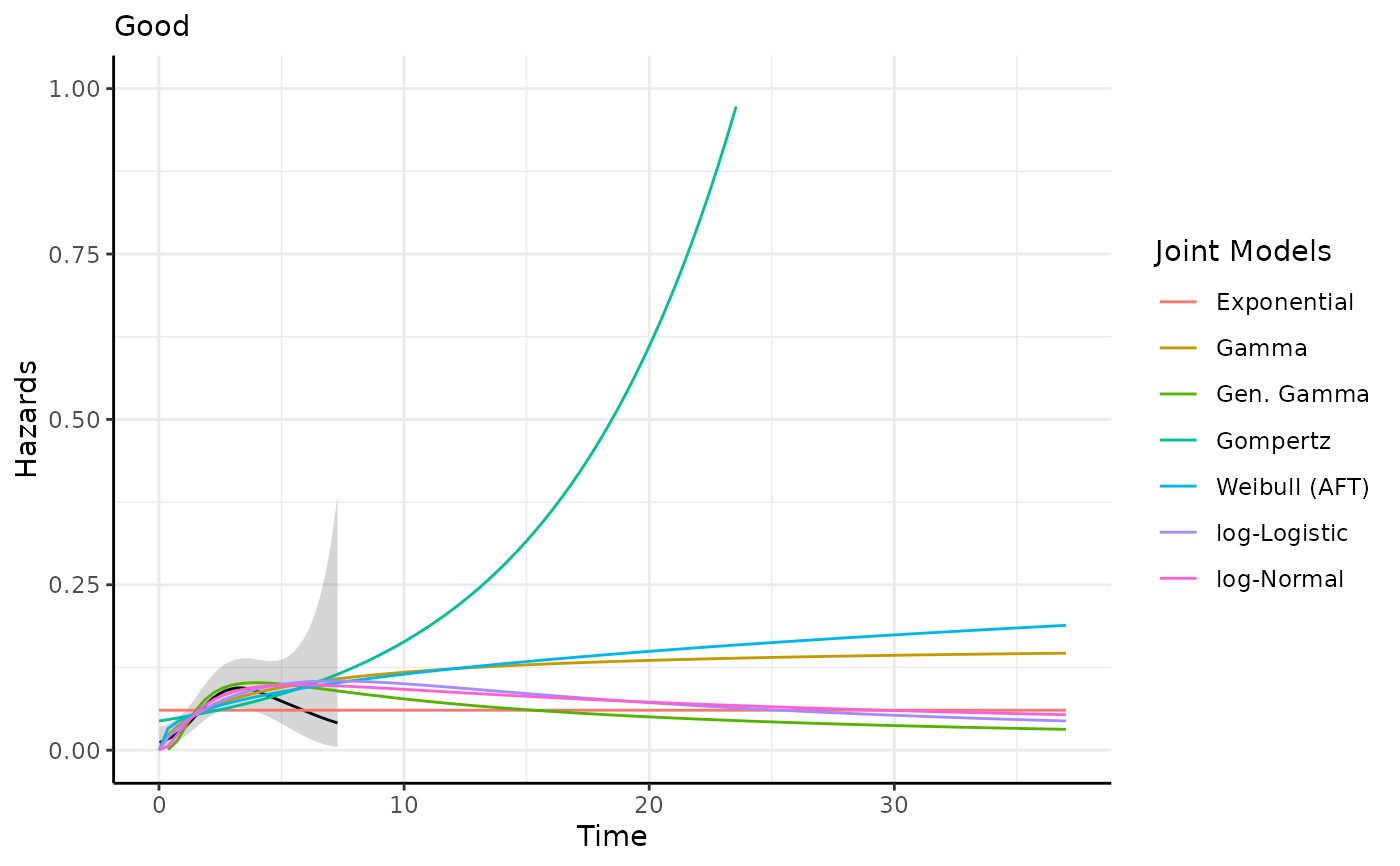
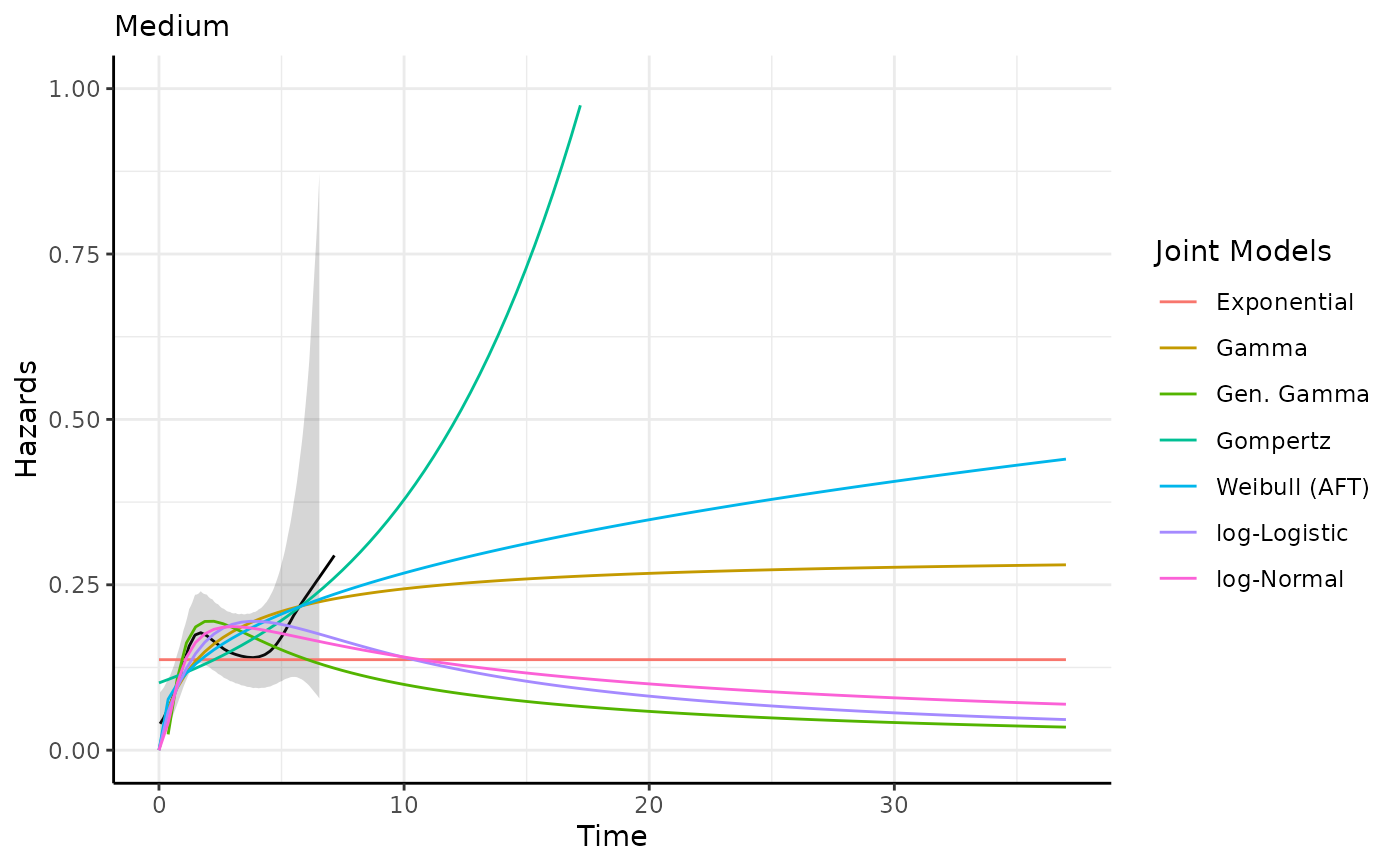
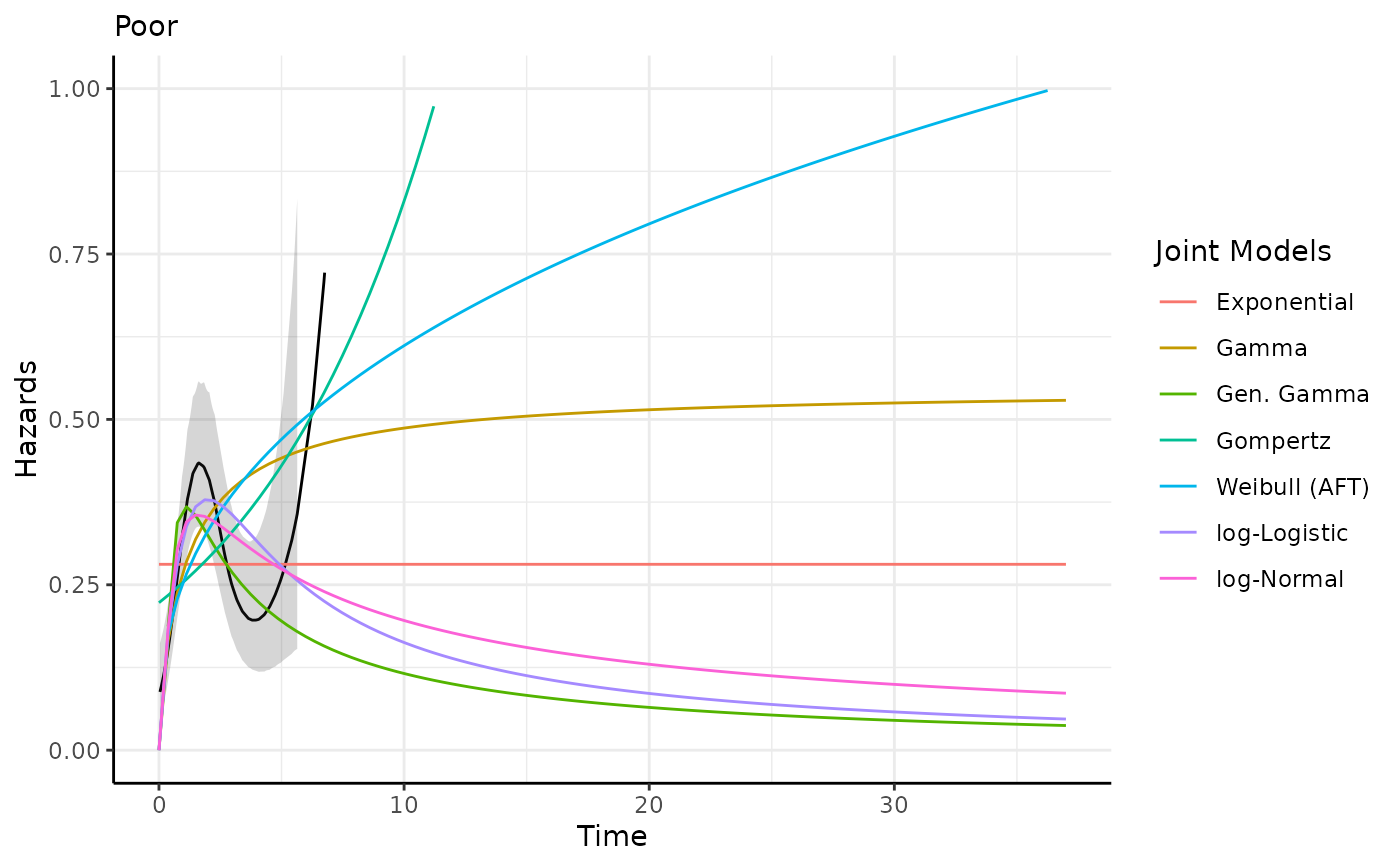
Plot method for fit_models
Usage
# S3 method for class 'fit_models'
plot(
  x,
  eval_time = NULL,
  km_include = TRUE,
  subtitle_include = TRUE,
  add_plotly = FALSE,
  ...
)
Arguments
- x
An object of class
fit_models- eval_time
Time points at which to evaluate the survival function. Default is
NULL.- km_include
Logical value indicating whether to include Kaplan-Meier survival data. Default is
TRUE.- subtitle_include
Logical value indicating whether to include a subtitle in the plot. Default is
TRUE.- add_plotly
Logical value indicating whether to add plotly interactivity. Default is
FALSE.- ...
Additional arguments
Value
A list containing predictions and plots for the survival and hazards
of models in a fit_models object.
Examples
models <- fit_models(
  data = easysurv::easy_bc,
  time = "recyrs",
  event = "censrec",
  predict_by = "group",
  covariates = "group"
)

plot(models)
#> ℹ Survival plots have been printed.
#> ℹ Hazard plots have been printed.